When the power is out, it makes peoples’ lives very hard. Things like cooking, bathing, and staying warm become difficult, if not impossible. Because of the importance of electricity in our everyday lives, we have regulators like the Kentucky Public Service Commission to oversee utilities in Kentucky.
But what if consumers or advocates want to dig deeper into power outages to look for trends or better understand why power outages are occurring? How can they get historical data about outages? Until now, there hasn’t been a way.
LG&E and KU Energy Outage Data
Today, we are announcing the availability of a dataset of LG&E and KU Energy outages. The dataset starts on December 7, 2019 and will have new outages added to it as they occur. Our hope is that this dataset will become more and more useful as it grows.
The data comes from the LG&E/KU outage map. Each outage is catalogued and stored for future analysis.
Every 6 hours, we publish the data to an online database that anyone can access at http://poweroutages.openkentuckiana.org/outages.
This online database is powered by a tool called Datasette that allows for exploration of the data. The data can be viewed and explored by clicking through the website or by using the SQL query language. We know that there is still a level of technical knowlege required to work with the data. It’s our hope that others will take the data, perform analysis on it, and share their findings.
One such example is the San Francisco Chronicle’s project that used historical PG&E data to build an app comparing wind speed and power outages.
Please reach out if you have ideas about how to use the data and need any help.
Understading the database
We are following the same format Simon Willison used for his PG&E outage tracking project. He has a great explanation for how the database works (adapted for LG&E/KU):
The three key tables to understand are
outages,snapshotsandoutage_snapshots.LG&E/KU assigns an outage ID to every outage. I store these in the outages table.
Every 15 minutes I grab a snapshot of storm map, which reports every single outage that is currently ongoing. I store a record of when I grabbed that snapshot in the snapshots table.
The most interesting table is
outage_snapshots. Every time I see an outage on the storm map, I record a new copy of its data as anoutage_snapshotrow. This allows me to reconstruct the full history of any outage, in 15 minute increments.Here are all of the outages that were represented in snapshot 68—captured at 12:17pm Eastern Time on December 8, 2019.
I can run
select sum(estCustAffected) from outage_snapshots where snapshot = 68(try it here) to count up the total LG&E/KU estimate of the number of affected customers (314 at this time).
Visualizing data
It is possible to visualize outage data using a couple of Datasette plugins that we have installed.
Each table has tools to build charts and maps. For example:
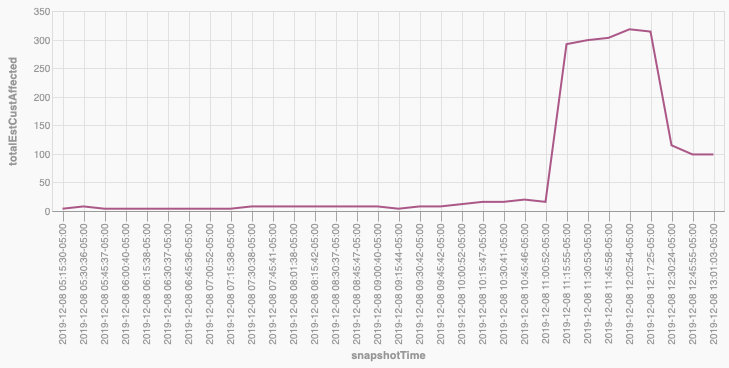 Here is a chart of the number of affected customers over time.
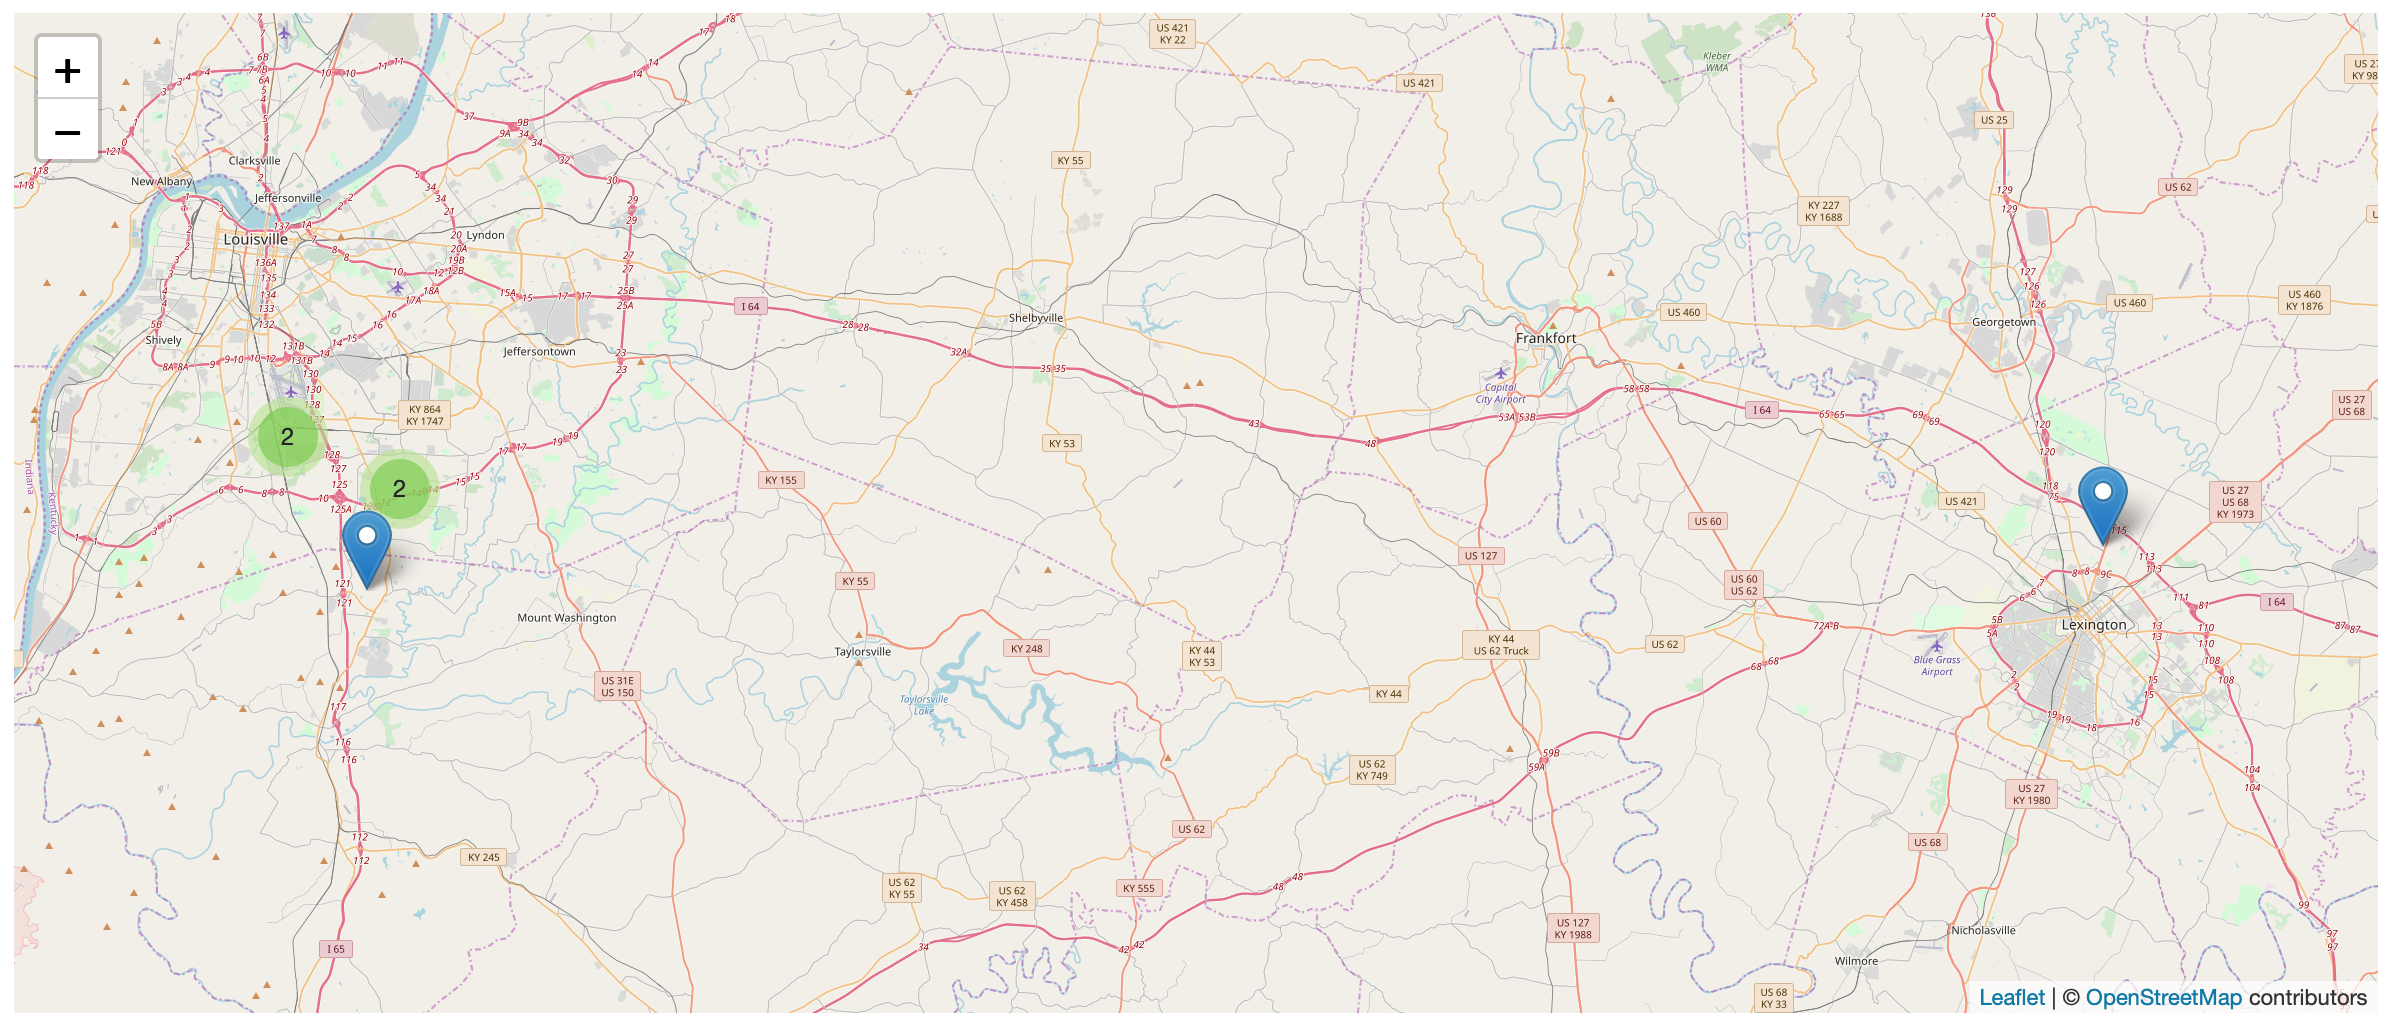 Here is a map the outages included in the most recent snapshot.
Raw Data
If you would like to work with the raw SQLite database, you can download it here: http://poweroutages.openkentuckiana.org/outages.db
Technical Details
This project was inspried by Simon Willison’s PG&E outage tracking project, and it follows the same pattern he created and uses some of his code as a starting point.
How we get the data
The data is scraped from the LG&E/KU website using the lgeku_scraper contained in our kubra-scraper repository . LG&E/KU uses a product called Kubra Storm Center to power their online map, and we’ve tried to make the underlying scraper generic enough to be used for other utilites that use Kubra. We’d love other brigades to try to use our code for utilities in their area.
The outage information we scrape is stored in JSON format in our power-outage-data repository in a file named outages.json. One of Simon’s insights was that the commit history of a file is something an average user can read, and the JSON in the file is also somewhat approachable.
Every 6 hours, we execute the build_database script in the power-outage-data repo to parse the history of outages.json and convert that data into a SQLite database, which is then published with Datasette.
Important Caveats
As with any scraped data, certian assumptions had to be made about the source data.
To try to ensure our data is accurate, we first load a currentState object from Kubra, using an instanceId and regionId we got from the Storm Center web app. This file tells us a couple pieces of information – 1) the url to the most recent data (which changes every few minutes) and 2) identifiers we can use to load a serviceareas.json file, which will tell us the geometry for the entire service area. This step ensures that we are looking for outages in the entire service area.
Next, we load another file the Storm Center uses, <most recent data>/public/summary-1/data.json. This file contains a count of the total number of outages. After running code to load all of the outages by loading zoomed-in parts of the map, we verify that the number of outages we found matches the summary’s number of total outages. If it doesn’t, we don’t save the data, and we log an error.
As for the data, it’s fairly straightforward, and we mostly store it using the same format we receive it in. Here’s what raw outage data looks like:
"desc": {
    "cluster": false,
    "etr": "2019-12-07T21:30:00Z",
    "comments": "This estimated time of restoration is based on historical averages of the time required to make similar repairs in this area.  We will update the estimate as more information becomes available.  Please check back for updates.",
    "cause": {
    "EN-US": "Working to determine cause"
    },
    "n_out": 1,
    "cust_a": {
        "val": 8
    },
    "inc_id": "19151346",
    "crew_status": null,
    "etr_confidence": null,
    "crew_icon": false,
    "start_time": "2019-12-07T18:22:16Z"
}
Note: The outage map only supports data to a zoom level of 14, so any outages that are still clustered (very close together) at this zoom level can’t be individually identified. In this case, we set the ID to the geometry polyline plus the start time of the cluster, since we won’t have an incident ID.
We do make some assumptions about the data:
etrmeans estimated time to resolution.n_outrepresents the number of outages. It should always be1for a non-cluster outage.cust_a.valis the number of customers affected.
We always welcome feedback or examinations of our code to ensure the data is accurate. Please reach out if you spot any issues or have any questions.